Startup funding by city
Updated 9 Nov 2026
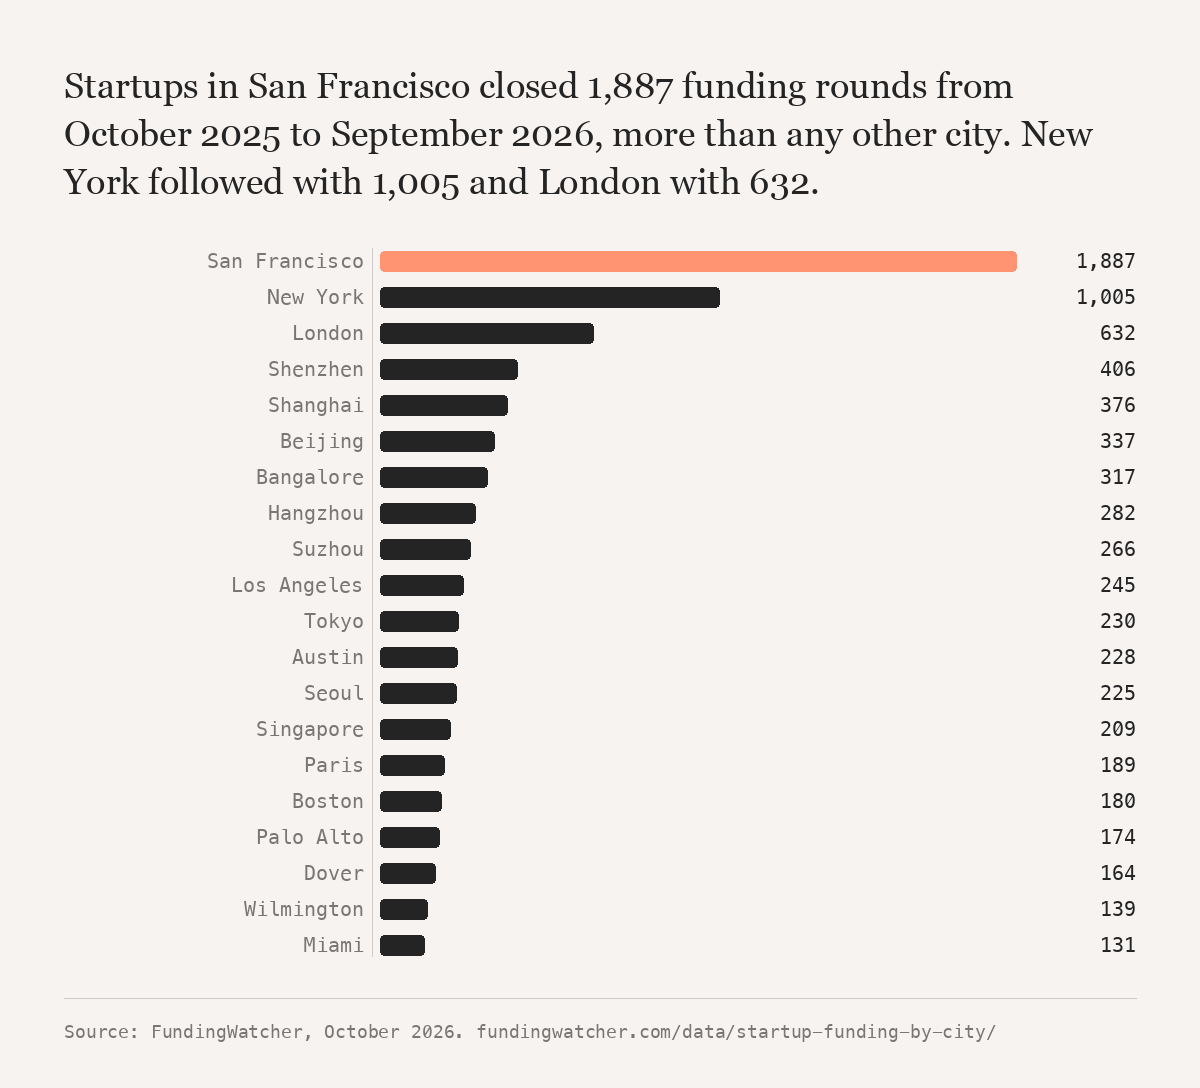
Startups in San Francisco closed 1,903 funding rounds from November 2025 to October 2026, more than any other city. New York followed with 1,041 and London with 620. Source: FundingWatcher, November 2026.
- Value
- 1,903
- Unit
- startup funding rounds in San Francisco, November 2025 to October 2026
- Data as of
- 9 November 2026
- Source
- FundingWatcher, November 2026
City
| Rank | City | Country | Rounds | Share of all rounds | Raised |
|---|---|---|---|---|---|
| 1 | San Francisco | United States | 1,903 | 9.6% | $33.3B |
| 2 | New York | United States | 1,041 | 5.2% | $24.9B |
| 3 | London | United Kingdom | 620 | 3.1% | $8.8B |
| 4 | Shenzhen | China | 411 | 2.1% | $5.7B |
| 5 | Shanghai | China | 383 | 1.9% | $5.9B |
| 6 | Beijing | China | 354 | 1.8% | $7.1B |
| 7 | Bangalore | India | 322 | 1.6% | $3.4B |
| 8 | Hangzhou | China | 278 | 1.4% | $18B |
| 9 | Suzhou | China | 256 | 1.3% | $2.2B |
| 10 | Austin | United States | 246 | 1.2% | $8.7B |
| 11 | Los Angeles | United States | 246 | 1.2% | $3.7B |
| 12 | Tokyo | Japan | 228 | 1.1% | $1.5B |
| 13 | Seoul | South Korea | 226 | 1.1% | $1.4B |
| 14 | Singapore | Singapore | 198 | 1.0% | $3.2B |
| 15 | Paris | France | 189 | 0.9% | $7.8B |
| 16 | Palo Alto | United States | 174 | 0.9% | $29.2B |
| 17 | Boston | United States | 173 | 0.9% | $4.3B |
| 18 | Dover | United States | 162 | 0.8% | $383.9M |
| 19 | Wilmington | United States | 137 | 0.7% | $497.7M |
| 20 | Miami | United States | 128 | 0.6% | $1.3B |
| 21 | Berlin | Germany | 125 | 0.6% | $1.2B |
| 22 | Chicago | United States | 124 | 0.6% | $916.2M |
| 23 | Haidian | China | 121 | 0.6% | $3.3B |
| 24 | Seattle | United States | 119 | 0.6% | $1.6B |
| 25 | Gurgaon | India | 115 | 0.6% | $604.3M |
| 26 | Mumbai | India | 113 | 0.6% | $1.2B |
| 27 | Dubai | United Arab Emirates | 107 | 0.5% | $668.2M |
| 28 | Brooklyn | United States | 96 | 0.5% | $1.5B |
| 29 | Toronto | Canada | 93 | 0.5% | $1.9B |
| 30 | Riyadh | Saudi Arabia | 88 | 0.4% | $1.3B |
| 31 | Cambridge | United States | 88 | 0.4% | $2.6B |
| 32 | Stockholm | Sweden | 85 | 0.4% | $2.2B |
| 33 | Munich | Germany | 85 | 0.4% | $3.3B |
| 34 | Hefei | China | 85 | 0.4% | $1.1B |
| 35 | Barcelona | Spain | 82 | 0.4% | $742.6M |
| 36 | Atlanta | United States | 80 | 0.4% | $581.5M |
| 37 | Tel Aviv | Israel | 79 | 0.4% | $2.1B |
| 38 | São Paulo | Brazil | 78 | 0.4% | $602.1M |
| 39 | San Diego | United States | 76 | 0.4% | $4.8B |
| 40 | Denver | United States | 75 | 0.4% | $4.4B |
| 41 | Nanjing | China | 74 | 0.4% | $654.2M |
| 42 | Amsterdam | The Netherlands | 73 | 0.4% | $1.4B |
| 43 | Chengdu | China | 73 | 0.4% | $1B |
| 44 | Copenhagen | Denmark | 72 | 0.4% | $449.8M |
| 45 | Houston | United States | 70 | 0.4% | $986.9M |
| 46 | San Jose | United States | 68 | 0.3% | $4.2B |
| 47 | Zürich | Switzerland | 68 | 0.3% | $802.3M |
| 48 | Milan | Italy | 67 | 0.3% | $489.1M |
| 49 | Washington | United States | 66 | 0.3% | $827.8M |
| 50 | Sydney | Australia | 64 | 0.3% | $916.9M |
| 51 | Guangzhou | China | 64 | 0.3% | $1.7B |
| 52 | Hong Kong | Hong Kong | 63 | 0.3% | $1.2B |
| 53 | Newark | United States | 60 | 0.3% | $52.2M |
| 54 | Mountain View | United States | 59 | 0.3% | $2.5B |
| 55 | Wuhan | China | 59 | 0.3% | $545M |
| 56 | New Delhi | India | 54 | 0.3% | $236.5M |
| 57 | Dublin | Ireland | 53 | 0.3% | $479.3M |
| 58 | Dallas | United States | 51 | 0.3% | $1.1B |
| 59 | Menlo Park | United States | 49 | 0.2% | $1.2B |
| 60 | Madrid | Spain | 49 | 0.2% | $424.8M |
| 61 | Montréal | Canada | 47 | 0.2% | $517.6M |
| 62 | Istanbul | Turkey | 47 | 0.2% | $113.2M |
| 63 | Sunnyvale | United States | 44 | 0.2% | $1.1B |
| 64 | Helsinki | Finland | 44 | 0.2% | $390.7M |
| 65 | Hyderabad | India | 44 | 0.2% | $212.8M |
| 66 | Pune | India | 43 | 0.2% | $174.8M |
| 67 | Seongnam | South Korea | 43 | 0.2% | $305.9M |
| 68 | Lagos | Nigeria | 42 | 0.2% | $276.3M |
| 69 | Berkeley | United States | 42 | 0.2% | $690.3M |
| 70 | Minhang | China | 41 | 0.2% | $562.7M |
| 71 | Cambridge | United Kingdom | 40 | 0.2% | $1.7B |
| 72 | Noida | India | 40 | 0.2% | $204.2M |
| 73 | Pittsburgh | United States | 39 | 0.2% | $361.4M |
| 74 | Nashville | United States | 39 | 0.2% | $307.3M |
| 75 | Santa Clara | United States | 39 | 0.2% | $3.4B |
| 76 | Melbourne | Australia | 39 | 0.2% | $311.9M |
| 77 | Philadelphia | United States | 39 | 0.2% | $559.9M |
| 78 | San Mateo | United States | 38 | 0.2% | $1.3B |
| 79 | Minneapolis | United States | 36 | 0.2% | $242.5M |
| 80 | Redwood City | United States | 34 | 0.2% | $3.2B |
| 81 | Chennai | India | 34 | 0.2% | $156.9M |
| 82 | Santa Monica | United States | 33 | 0.2% | $132.1M |
| 83 | Las Vegas | United States | 32 | 0.2% | $462.4M |
| 84 | Delhi | India | 32 | 0.2% | $81.5M |
| 85 | Ningbo | China | 31 | 0.2% | $175M |
| 86 | Salt Lake City | United States | 30 | 0.2% | $226.2M |
| 87 | Vienna | Austria | 30 | 0.2% | $111.1M |
| 88 | Warsaw | Poland | 30 | 0.2% | $100.6M |
| 89 | Wuxi | China | 30 | 0.2% | $211.4M |
| 90 | Bellevue | United States | 29 | 0.1% | $783.9M |
| 91 | Ghent | Belgium | 29 | 0.1% | $193M |
| 92 | Boulder | United States | 29 | 0.1% | $677.2M |
| 93 | Irvine | United States | 29 | 0.1% | $598.1M |
| 94 | Prague | Czech Republic | 29 | 0.1% | $56.3M |
| 95 | Lewes | United States | 29 | 0.1% | $64.8M |
| 96 | Shandong | China | 29 | 0.1% | $78.6M |
| 97 | Tampa | United States | 28 | 0.1% | $79.8M |
| 98 | Raleigh | United States | 27 | 0.1% | $267.6M |
| 99 | Abu Dhabi | United Arab Emirates | 27 | 0.1% | $394.5M |
| 100 | Tallinn | Estonia | 25 | 0.1% | $181.9M |
Table 1. Startup funding by city. Source: FundingWatcher. Data as of 9 November 2026. Base: 19,900.
Previous values
| Month | Data as of | Value |
|---|---|---|
| November 2026 | 9 November 2026 | 1,903 |
| October 2026 | 26 October 2026 | 1,898 |
| September 2026 | 28 September 2026 | 1,790 |
Table 2. Startup funding by city, value at each monthly update. Source: FundingWatcher. Data as of 9 November 2026.
Method: Rounds dated November 2025 to October 2026, counted from the startup file of 9 November 2026. The file keeps each company's most recent pre-seed, seed, angel or Series A to J round only, so a company that raised twice in the window counts once. City is the company's headquarters as recorded. Full method.
Cite or embed
https://fundingwatcher.com/data/startup-funding-by-city/
<a href="https://fundingwatcher.com/data/startup-funding-by-city/"><img src="https://fundingwatcher.com/static/figures/startup-funding-by-city.png" alt="Startups in San Francisco closed 1,903 funding rounds from November 2025 to October 2026, more than any other city. New York followed with 1,041 and London with 620." width="1200" style="max-width:100%;height:auto"></a>
<p>Source: <a href="https://fundingwatcher.com/data/startup-funding-by-city/">FundingWatcher</a>, November 2026</p>
Dashboard · All figures and tables
Full lists as CSV
One-time per list| List | Rows | |
|---|---|---|
| Startups funded in the last 90 days | 4,476 | |
| Angel investors | 23,916 | |
| Venture capital firms | 23,051 | |
| Private equity firms | 9,693 | |
| Investment partners | 6,734 | |
| Startup accelerators | 3,207 | |
| Micro VC funds | 2,364 | |
| All lists: 79,515 investors and 167,037 startups, two files | 246,552 |
Sample rows
first 10 of 4,476, Startups funded in the last 90 days| name | website | founded | employees | city | region | country | sectors | funding_stage | last_round | last_round_date | last_round_usd | total_raised_usd | rounds | investors |
|---|---|---|---|---|---|---|---|---|---|---|---|---|---|---|