Y Combinator success rate: 43.1% of YC companies from 2005 to 2019 raised a Series A or exited
Updated 23 Oct 2026
43.1% of the 2,034 companies in Y Combinator's 2005 to 2019 batches raised a Series A or later, were acquired or went public. 32.2% are inactive by YC's own count and 3.5% carry Crunchbase's unicorn tag. Source: FundingWatcher, October 2026.
- Value
- 43.1%
- Unit
- share of companies in Y Combinator's 2005 to 2019 batches that raised a Series A or later, were acquired or went public
- Data as of
- 23 October 2026
- Source
- FundingWatcher, October 2026
Definition
- Cohort
- 2,034 companies in Y Combinator's public directory with a batch from 2005 to 2019, including inactive and acquired ones
- Success
- raised a Series A or later, or YC lists the company as acquired or public
- Series A or later
- Crunchbase last round Series A to J, private equity or post-IPO
- Inactive
- YC's directory status Inactive
- Unicorn
- Crunchbase unicorn or exited unicorn tag
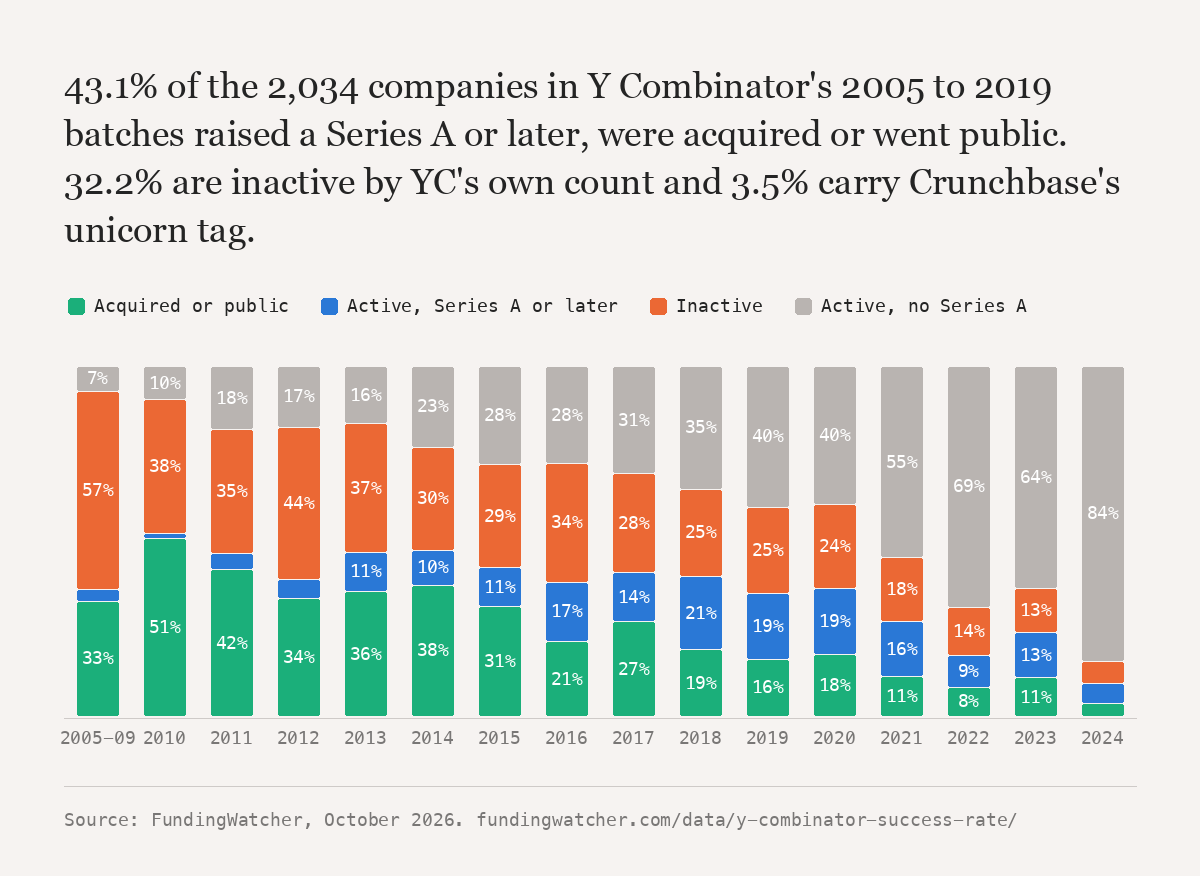
Batches 2005 to 2019
| Outcome | Companies | Share | 95% interval |
|---|---|---|---|
| Raised a Series A or later, acquired or public | 877 | 43.1% | 41.0 to 45.3 |
| Raised a Series A or later | 470 | 23.1% | 21.3 to 25.0 |
| Acquired | 536 | 26.4% | 24.5 to 28.3 |
| Public | 22 | 1.1% | 0.7 to 1.6 |
| Inactive | 655 | 32.2% | 30.2 to 34.3 |
| Unicorn tag | 72 | 3.5% | 2.8 to 4.4 |
Table 1. Y Combinator success rate, by batches 2005 to 2019. Source: FundingWatcher. Data as of 23 October 2026. Base: 2,034.
Batch year
| Batch year | Companies | Series A or later, acquired or public | Series A or later | Acquired or public | Inactive | Unicorn tag |
|---|---|---|---|---|---|---|
| 2005 to 2009 | 143 | 37.1% | 12.6% | 32.9% | 56.6% | 2 |
| 2010 | 63 | 54.0% | 15.9% | 50.8% | 38.1% | 2 |
| 2011 | 105 | 46.7% | 11.4% | 41.9% | 35.2% | 6 |
| 2012 | 149 | 41.6% | 22.8% | 33.6% | 43.6% | 7 |
| 2013 | 98 | 50.0% | 25.5% | 35.7% | 36.7% | 4 |
| 2014 | 152 | 49.3% | 19.7% | 37.5% | 29.6% | 7 |
| 2015 | 214 | 44.4% | 22.4% | 31.3% | 29.4% | 10 |
| 2016 | 224 | 43.3% | 28.6% | 21.4% | 33.9% | 14 |
| 2017 | 241 | 43.2% | 22.8% | 27.0% | 28.2% | 8 |
| 2018 | 277 | 43.3% | 29.6% | 19.1% | 24.9% | 9 |
| 2019 | 368 | 37.8% | 25.0% | 16.3% | 24.7% | 3 |
| 2020 | 438 | 39.0% | 23.7% | 17.6% | 24.0% | 4 |
| 2021 | 726 | 27.5% | 16.9% | 11.3% | 18.3% | 0 |
| 2022 | 631 | 17.6% | 9.5% | 8.4% | 13.8% | 0 |
| 2023 | 494 | 23.9% | 13.0% | 11.1% | 12.6% | 0 |
| 2024 | 590 | 9.5% | 5.8% | 3.7% | 6.3% | 0 |
| All, 2005 to 2019 | 2,034 | 43.1% | 23.1% | 27.4% | 32.2% | 72 |
Table 2. Y Combinator success rate, by batch year. Source: FundingWatcher. Data as of 23 October 2026. Base: 4,913.
Previous values
| Month | Data as of | Value |
|---|
Table 3. Y Combinator success rate, value at each monthly update. Source: FundingWatcher. Data as of 23 October 2026.
Method: 6,322 companies in Y Combinator's public company directory, read 2026-10-21, joined to Crunchbase (read 2026-10-21) by website domain; 83.2% of the 2005 to 2019 companies matched. Acquired, public and inactive are YC's own status. A company with no Crunchbase match counts as not having raised a Series A. Acquisitions include small acquisitions and acqui-hires. Crunchbase's unicorn tag misses some companies valued at a billion dollars or more, so the unicorn count is a floor. Batches from 2020 on are shown for reference and left out of the totals because they are too young. Accelerator success rate. Startup failure rate. Full method.
Cite or embed
https://fundingwatcher.com/data/y-combinator-success-rate/
<a href="https://fundingwatcher.com/data/y-combinator-success-rate/"><img src="https://fundingwatcher.com/static/figures/y-combinator-success-rate.png" alt="43.1% of the 2,034 companies in Y Combinator's 2005 to 2019 batches raised a Series A or later, were acquired or went public. 32.2% are inactive by YC's own count and 3.5% carry Crunchbase's unicorn tag." width="1200" style="max-width:100%;height:auto"></a>
<p>Source: <a href="https://fundingwatcher.com/data/y-combinator-success-rate/">FundingWatcher</a>, October 2026</p>