Accelerator success rate
Updated 23 Oct 2026
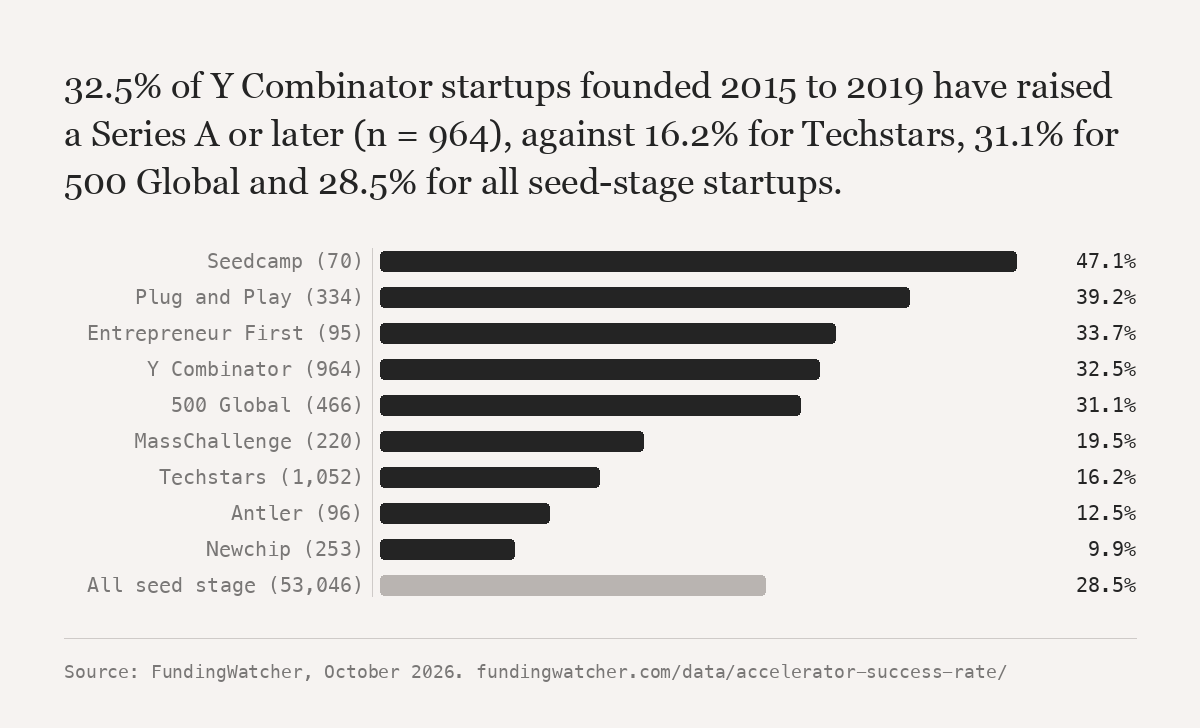
32.5% of Y Combinator startups founded 2015 to 2019 have raised a Series A or later (n = 964), against 16.2% for Techstars, 31.1% for 500 Global and 28.5% for all seed-stage startups. Source: FundingWatcher, October 2026.
- Value
- 32.5%
- Unit
- share of Y Combinator startups founded 2015 to 2019 that raised a Series A or later
- Data as of
- 23 October 2026
- Source
- FundingWatcher, October 2026
Accelerator, founded 2015 to 2019
| Accelerator | Startups | Series A or later | 95% interval | Marked closed | Acquired |
|---|---|---|---|---|---|
| Seedcamp | 70 | 47.1% | 35.9 to 58.7 | 2.9% | 21.4% |
| Plug and Play | 334 | 39.2% | 34.1 to 44.6 | 5.7% | 11.4% |
| Entrepreneur First | 95 | 33.7% | 25.0 to 43.7 | 5.3% | 15.8% |
| Y Combinator | 964 | 32.5% | 6.5% | 12.4% | |
| 500 Global | 466 | 31.1% | 27.1 to 35.5 | 7.1% | 10.1% |
| MassChallenge | 220 | 19.5% | 14.8 to 25.3 | 2.7% | 8.6% |
| Techstars | 1,052 | 16.2% | 5.9% | 10.2% | |
| Antler | 96 | 12.5% | 7.3 to 20.6 | 0.0% | 2.1% |
| Newchip Accelerator | 253 | 9.9% | 6.8 to 14.2 | 1.2% | 1.6% |
| All seed-stage startups | 53,046 | 28.5% | 5.7% | 4.4% |
Table 1. Accelerator success rate, by accelerator, founded 2015 to 2019. Source: FundingWatcher. Data as of 23 October 2026. Base: 53,046.
Previous values
| Month | Data as of | Value |
|---|---|---|
| October 2026 | 19 October 2026 | 32.5% |
Table 2. Accelerator success rate, value at each monthly update. Source: FundingWatcher. Data as of 23 October 2026.
Method: 327,370 Crunchbase records with a dated round, read 2026-10-19. A company is in a founding-year seed cohort when its last round is pre-seed, seed or angel, or when its last round is Series A to J or post-IPO and it has two or more rounds on file. Crunchbase keeps no round history, so we know the stage a company has reached by now, not when it got there. Companies whose last round is debt, a grant, a note or an unnamed venture round are left out. Only cohorts at least five years old are shown. An accelerator counts when Crunchbase lists it, or one of its programmes, among the company's investors. Intervals are Wilson 95% intervals, shown below 500 startups. Shares are not adjusted for country, industry or founding year. Seed to Series A rate. Y Combinator success rate. Full method.
Cite or embed
https://fundingwatcher.com/data/accelerator-success-rate/
<a href="https://fundingwatcher.com/data/accelerator-success-rate/"><img src="https://fundingwatcher.com/static/figures/accelerator-success-rate.png" alt="32.5% of Y Combinator startups founded 2015 to 2019 have raised a Series A or later (n = 964), against 16.2% for Techstars, 31.1% for 500 Global and 28.5% for all seed-stage startups." width="1200" style="max-width:100%;height:auto"></a>
<p>Source: <a href="https://fundingwatcher.com/data/accelerator-success-rate/">FundingWatcher</a>, October 2026</p>