Startup failure rate: 31.5% of seed startups founded 2015 to 2017 are dead
Updated 23 Oct 2026
About 31.5% of seed-stage startups founded 2015 to 2017 have failed (n = 30,826): Crunchbase marks 7.5% closed, and another 24.0% are dead while Crunchbase still lists them as active. Source: FundingWatcher, October 2026.
- Value
- 31.5%
- Unit
- estimated share of seed-stage startups founded 2015 to 2017 that are dead: marked closed without an acquisition, or dead while Crunchbase lists them as active
- Data as of
- 23 October 2026
- Source
- FundingWatcher, October 2026
Definition
- Cohort
- 30,826 seed-stage startups founded 2015 to 2017, eight to eleven years old
- Seed stage
- last round pre-seed, seed or angel, or a Series A or later with two or more rounds on file
- Failed
- marked closed on Crunchbase without an acquisition, or listed active with no later round and no exit while the website is gone, down, parked, a placeholder or another company's site
- Not failed
- acquired, raised a later round, or listed active with a working website
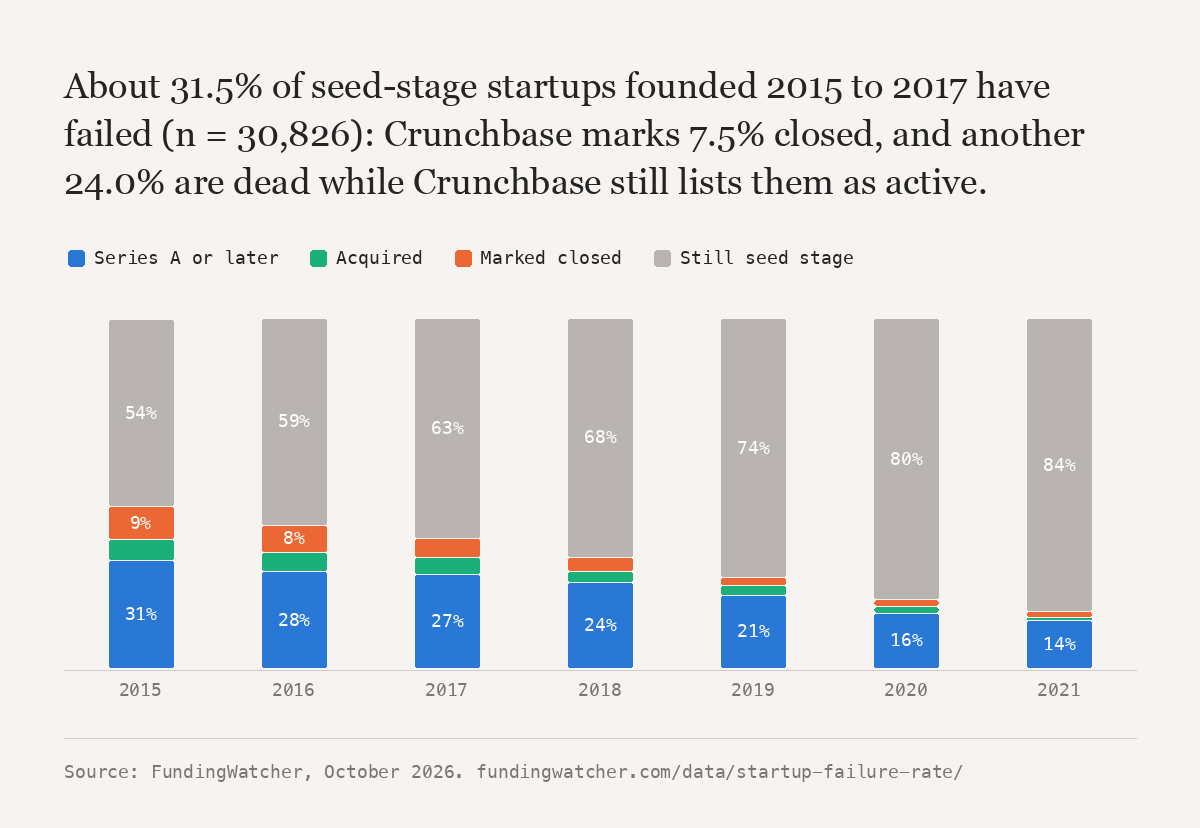
The 2015 to 2017 seed class
| Outcome | Startups | Share | Range |
|---|---|---|---|
| Marked closed, no acquisition | 2,310 | 7.5% | |
| Dead while listed as active, estimated | about 7,400 | 24.0% | 22.5 to 25.4 |
| Dead in total, estimated | about 9,700 | 31.5% |
Table 1. Startup failure rate, by the 2015 to 2017 seed class. Source: FundingWatcher. Data as of 23 October 2026. Base: 30,826.
Founding year
| Founded | Age | Seed-stage startups | Marked closed | Acquired | Series A or later |
|---|---|---|---|---|---|
| 2015 | 11 years | 10,335 | 9.4% | 6.0% | 35.2% |
| 2016 | 10 years | 10,001 | 7.8% | 5.6% | 31.3% |
| 2017 | 9 years | 10,455 | 5.4% | 4.8% | 29.3% |
| 2018 | 8 years | 10,831 | 4.0% | 3.3% | 25.8% |
| 2019 | 7 years | 11,424 | 2.4% | 2.6% | 22.0% |
| 2020 | 6 years | 13,524 | 2.0% | 1.8% | 16.4% |
| 2021 | 5 years | 14,375 | 1.5% | 1.0% | 13.9% |
Table 2. Startup failure rate, by founding year. Source: FundingWatcher. Data as of 23 October 2026. Base: 80,945.
Industry, founded 2015 to 2019
| Industry | Startups | Marked closed | Acquired |
|---|---|---|---|
| Commerce | 7,312 | 7.4% | 3.9% |
| Cybersecurity | 1,759 | 4.6% | 10.2% |
Table 3. Startup failure rate, by industry, founded 2015 to 2019. Source: FundingWatcher. Data as of 23 October 2026. Base: 53,046.
Previous values
| Month | Data as of | Value |
|---|
Table 4. Startup failure rate, value at each monthly update. Source: FundingWatcher. Data as of 23 October 2026.
Method: 327,370 Crunchbase records with a dated round, read 2026-10-19. A company is in a founding-year seed cohort when its last round is pre-seed, seed or angel, or when its last round is Series A to J or post-IPO and it has two or more rounds on file. Crunchbase keeps no round history, so we know the stage a company has reached by now, not when it got there. Companies whose last round is debt, a grant, a note or an unnamed venture round are left out. Only cohorts at least five years old are shown. The dead-while-active estimate is from our check of 1,500 of the 17,904 seed-stage startups founded 2015 to 2017 with no later round, no exit and a website on file: 41.3% (plus or minus 2.5 points) were gone, down, parked, a placeholder or someone else's site on 23 September 2026. The 2015 to 2017 class uses the startup file of 4 September 2026. Seed startups listed as active. Y Combinator success rate. Full method.
Cite or embed
https://fundingwatcher.com/data/startup-failure-rate/
<a href="https://fundingwatcher.com/data/startup-failure-rate/"><img src="https://fundingwatcher.com/static/figures/startup-failure-rate.png" alt="About 31.5% of seed-stage startups founded 2015 to 2017 have failed (n = 30,826): Crunchbase marks 7.5% closed, and another 24.0% are dead while Crunchbase still lists them as active." width="1200" style="max-width:100%;height:auto"></a>
<p>Source: <a href="https://fundingwatcher.com/data/startup-failure-rate/">FundingWatcher</a>, October 2026</p>