YC batches got twice as likely to repeat an earlier YC company, from 18% to 47%
Published 4 September 2026
We embedded every Y Combinator company with a working domain, 6,142 of them across 48 batches from Summer 2005 to Fall 2026, and measured two things: how much a batch looks like itself, and how much it looks like what YC funded before it.
Recent YC batches are far more alike than any batch before them, and far more likely to hold a company that looks like one YC already funded. The break is Winter 2023, the first batch where more than 30% of companies have a close match among 500 earlier YC companies, and it lines up with the AI wave. Through the 2010s a batch was more varied than a random pick of YC alumni, and every batch from Winter 2013 to Summer 2018 scored below its size-matched random control. In Summer 2025, 46.5% of the batch had a twin among earlier YC companies against 18.3% in 2013 to 2019, and 46 of the 195 companies in Spring 2026 sit in one connected chain of AI agent and automation startups.
Key findings
- In the average 2013 to 2019 batch, 18.3% of companies had a match at cosine 0.80 or above among a fixed random sample of 500 earlier YC companies. In Summer 2025 it was 46.5%.
- At the tighter 0.85 threshold the same measure runs 5.6% for 2013 to 2019 and 13.3% for 2023 to 2026, peaking at 16.5% in Summer 2025.
- Every batch from Winter 2013 to Summer 2018 was less internally similar than a random draw of YC companies of the same size. Within batch the average pair scored 0.416 to 0.432; the random draws scored 0.455 to 0.467.
- From Winter 2023 on, average within-batch similarity is above 0.50 in every batch, with a high of 0.560 in Summer 2025.
- The average company's closest batchmate scored 0.598 in Summer 2010 and 0.645 in Winter 2015. In Summer 2025 it was 0.790 and in Spring 2026 it was 0.793.
- In Spring 2026, 46 of 195 companies sit in one connected chain at 0.80 or above. Summer 2023 has a 37-company chain and Winter 2024 a 27-company one. No batch between Winter 2013 and Summer 2015 has a chain larger than 3.
- From Winter 2014 to Summer 2024, a company's closest match in the previous batch never differs from the 500-random-YC control by more than 0.013, so the batch just before yours is no closer than a random 500. A gap opens only from Winter 2025, averaging 0.020 across the last seven batches.
- For 2013 to 2019 batches, the share with a 0.80 match among 500 random earlier companies is 18.3%, and among 500 random later companies it is 18.8%, so the direction of time does not change the number.
The vectors describe each company as its website describes it today, not as it was at batch time, so part of the recent-batch effect is older companies converging after the fact.
Summer 2025 has an earlier YC twin for 46.5% of the batch, against 18.3% in 2013 to 2019
The measure is one number per company: its highest cosine against a random sample of 500 companies from earlier batches. We then count the share of the batch whose best match clears 0.80. We average ten draws of the 500 so the answer does not hang on one sample.
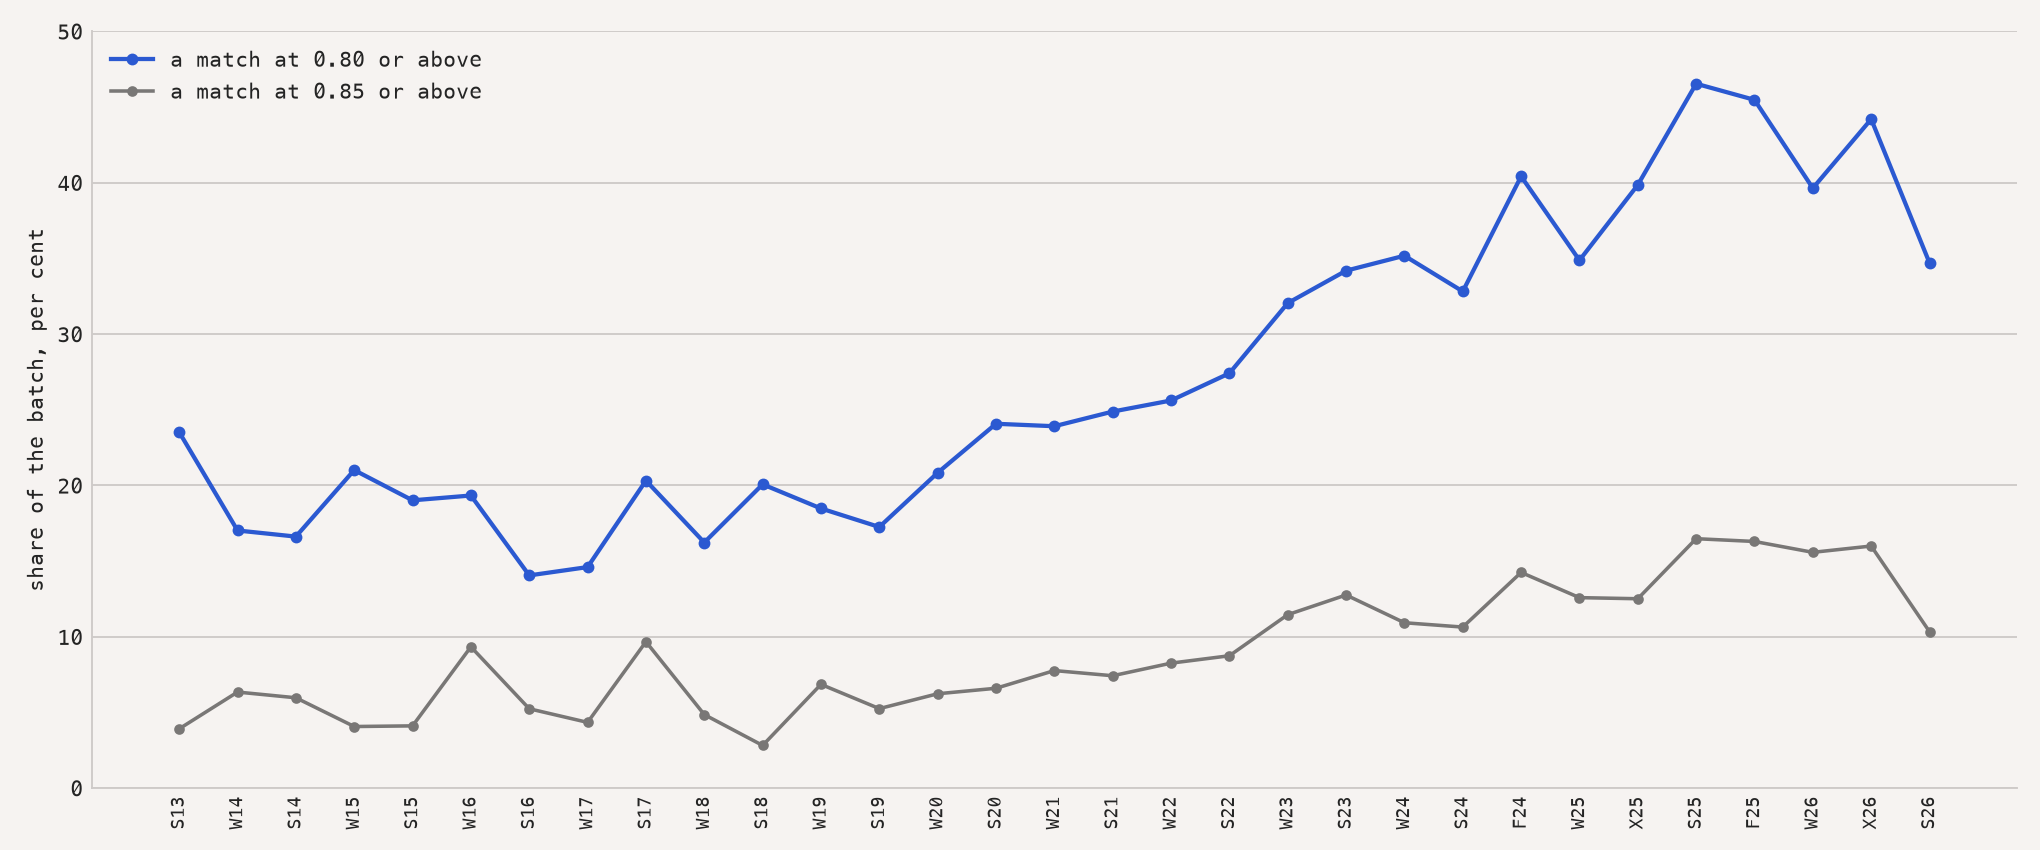
Share of each batch with a match at 0.80 and at 0.85 among a fixed random sample of 500 earlier YC companies, ten draws averaged.
The 2013 to 2019 batches sit in a band between 14.1% and 23.5%, averaging 18.3%. The line starts moving in Winter 2020 and does not come back down. Winter 2023 is the first batch over 30%. Summer 2025 is the high at 46.5%, and the four batches around it run 34.9%, 39.9%, 45.5% and 44.2%.
Summer 2026, the most recent batch in the file with 30 or more companies, drops to 34.7%. We do not read anything into one batch yet.
| Batch | Companies | Match at 0.80 | Match at 0.85 |
|---|---|---|---|
| S13 | 51 | 23.5% | 3.9% |
| W14 | 74 | 17.0% | 6.4% |
| S14 | 77 | 16.6% | 6.0% |
| W15 | 108 | 21.0% | 4.1% |
| S15 | 102 | 19.0% | 4.1% |
| W16 | 121 | 19.3% | 9.3% |
| S16 | 101 | 14.1% | 5.2% |
| W17 | 115 | 14.6% | 4.3% |
| S17 | 124 | 20.3% | 9.7% |
| W18 | 146 | 16.2% | 4.9% |
| S18 | 131 | 20.1% | 2.8% |
| W19 | 191 | 18.5% | 6.9% |
| S19 | 175 | 17.3% | 5.3% |
| W20 | 226 | 20.8% | 6.2% |
| S20 | 206 | 24.1% | 6.6% |
| W21 | 332 | 23.9% | 7.8% |
| S21 | 389 | 24.9% | 7.4% |
| W22 | 397 | 25.6% | 8.3% |
| S22 | 232 | 27.4% | 8.8% |
| W23 | 273 | 32.1% | 11.5% |
| S23 | 217 | 34.2% | 12.8% |
| W24 | 247 | 35.2% | 10.9% |
| S24 | 248 | 32.8% | 10.6% |
| F24 | 94 | 40.4% | 14.3% |
| W25 | 166 | 34.9% | 12.6% |
| X25 | 143 | 39.9% | 12.5% |
| S25 | 165 | 46.5% | 16.5% |
| F25 | 146 | 45.5% | 16.3% |
| W26 | 197 | 39.6% | 15.6% |
| X26 | 195 | 44.2% | 16.0% |
| S26 | 236 | 34.7% | 10.3% |
Comparing against all 5,184 prior companies instead of 500 turns 46.5% into 89.1%
We threw the 89.1% away, because it is inflated by pool size. Summer 2013 was compared against 500 earlier companies and Summer 2025 against 5,184, so a late batch gets ten times as many chances to find a match. Any measure against "everything before" climbs with batch order on its own, and against the full pool the same test reads 23.5% for Summer 2013 and 89.1% for Summer 2025.
Holding the comparison pool at 500 removes that. We expected the control to kill the rise. It took out roughly half of it, and the rest survives, 18.3% to 46.5%. Every share in this report uses the fixed 500.
Twelve batches from Winter 2013 to Summer 2018 were less alike than a random draw of YC
We also measured within-batch similarity directly: the average cosine between every pair of companies in a batch, against the average cosine between every pair in a random draw of YC companies of the same size.
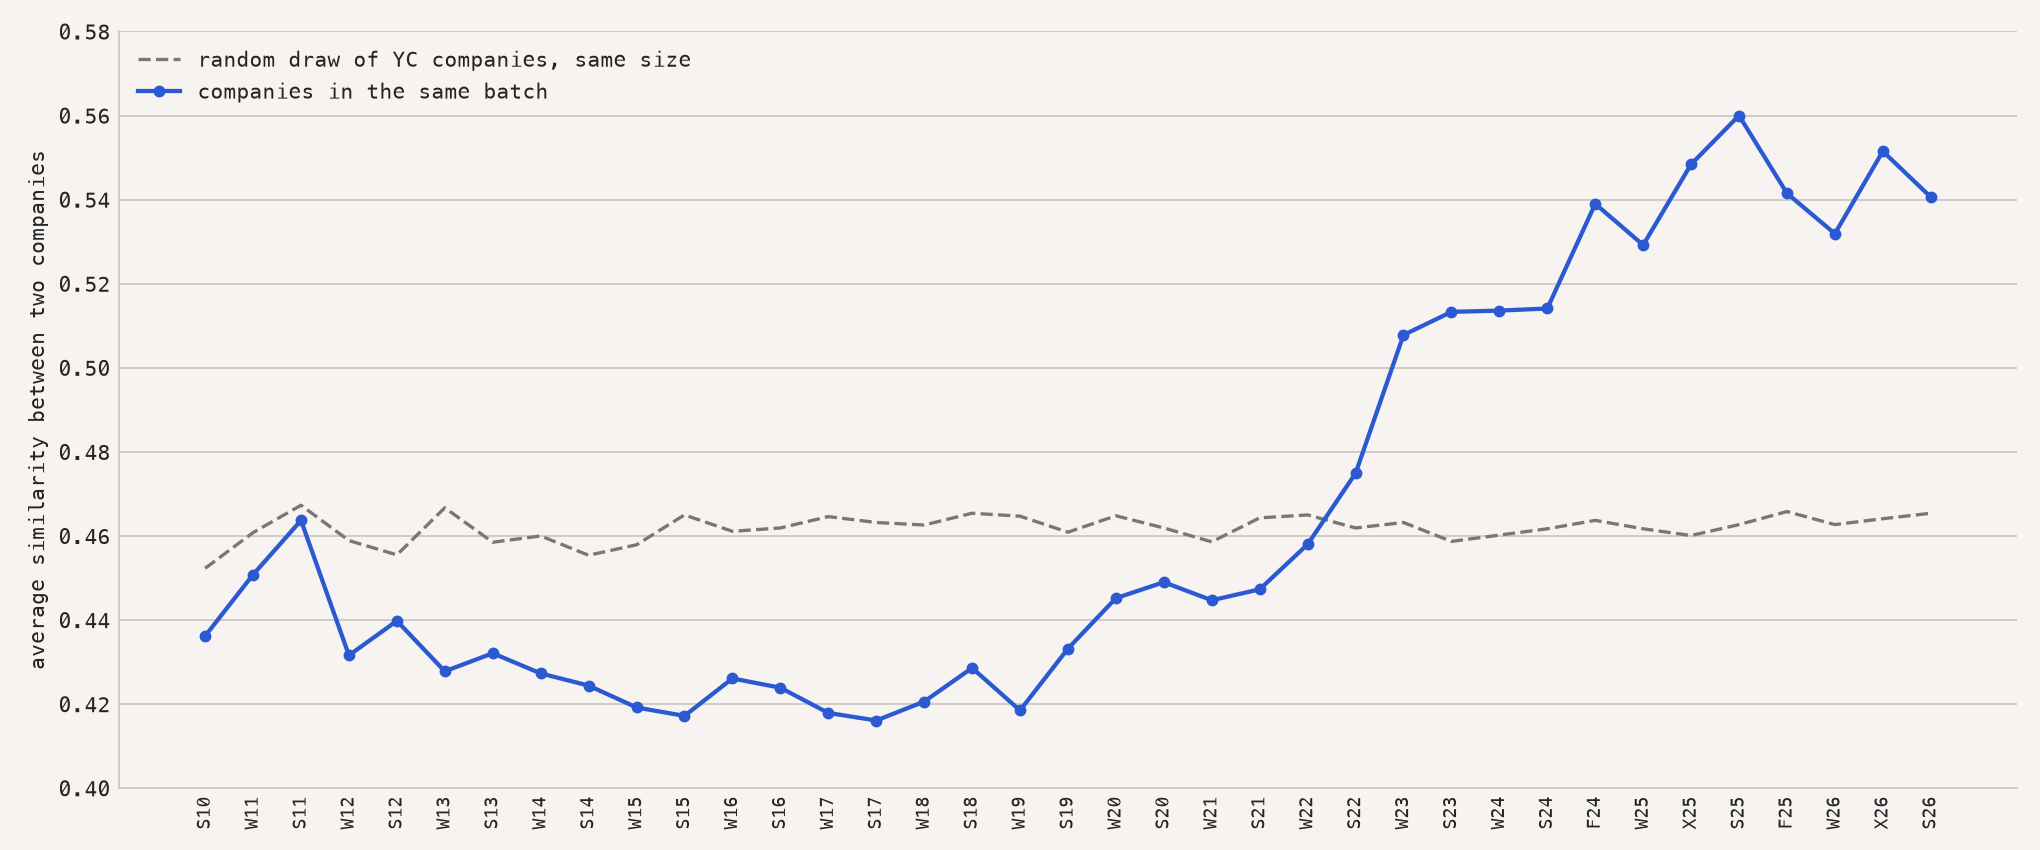
Average similarity between two companies in the same batch, and between two companies in a random draw of the same size from all years. Batches under 30 companies are left off.
All twelve batches from Winter 2013 to Summer 2018 fall below their control. Summer 2015 is the widest gap, 0.417 within batch against 0.465 for a random 102 YC companies. A Summer 2015 founder had slightly less in common with the person at the next desk than with a YC alum picked at random from any year.
Summer 2022 is the first batch since Winter 2010 to score above its control, by 0.013. Winter 2023 is 0.045 above, and every batch since is between 0.052 and 0.097 above.
The eight batches from Summer 2006 to Winter 2010 also sit above their controls, by 0.016 to 0.053, with Summer 2009 the one exception at 0.002 below. Those batches hold 11 to 26 companies each, so we leave them off the chart.
The closest match inside a batch went from 0.598 to 0.793
The pairwise average moves slowly because most pairs in a batch are unrelated. So we also looked at the nearest one: how close the single most similar company in a batch is.
| Batch | Companies | Closest batchmate |
|---|---|---|
| S10 | 36 | 0.598 |
| W15 | 108 | 0.645 |
| W20 | 226 | 0.720 |
| W23 | 273 | 0.771 |
| S25 | 165 | 0.790 |
| X26 | 195 | 0.793 |
Full per-batch numbers are in batch_stats.csv.
One chain of 46 companies covers just under a quarter of Spring 2026
Linking every pair at 0.80 or above and taking connected components gives a rough map of how much of a batch is one crowd. Spring 2026's largest component holds 46 of 195 companies. Summer 2023 has 37 of 217 and Winter 2024 has 27 of 247. Winter 2013 and Summer 2013 contain no pair at 0.80 at all, and no batch from Winter 2013 to Summer 2015 gets past a component of 3.
Components are transitive, so a 46-company chain does not mean 46 companies that all look alike. It means you can walk from any one of them to any other in steps of 0.80 or better.
The batch before yours is no closer than 500 random YC companies
We expected the previous batch to matter, because founders talk to the batch ahead of them and a hot idea in one batch should show up in the next. The numbers do not show that.
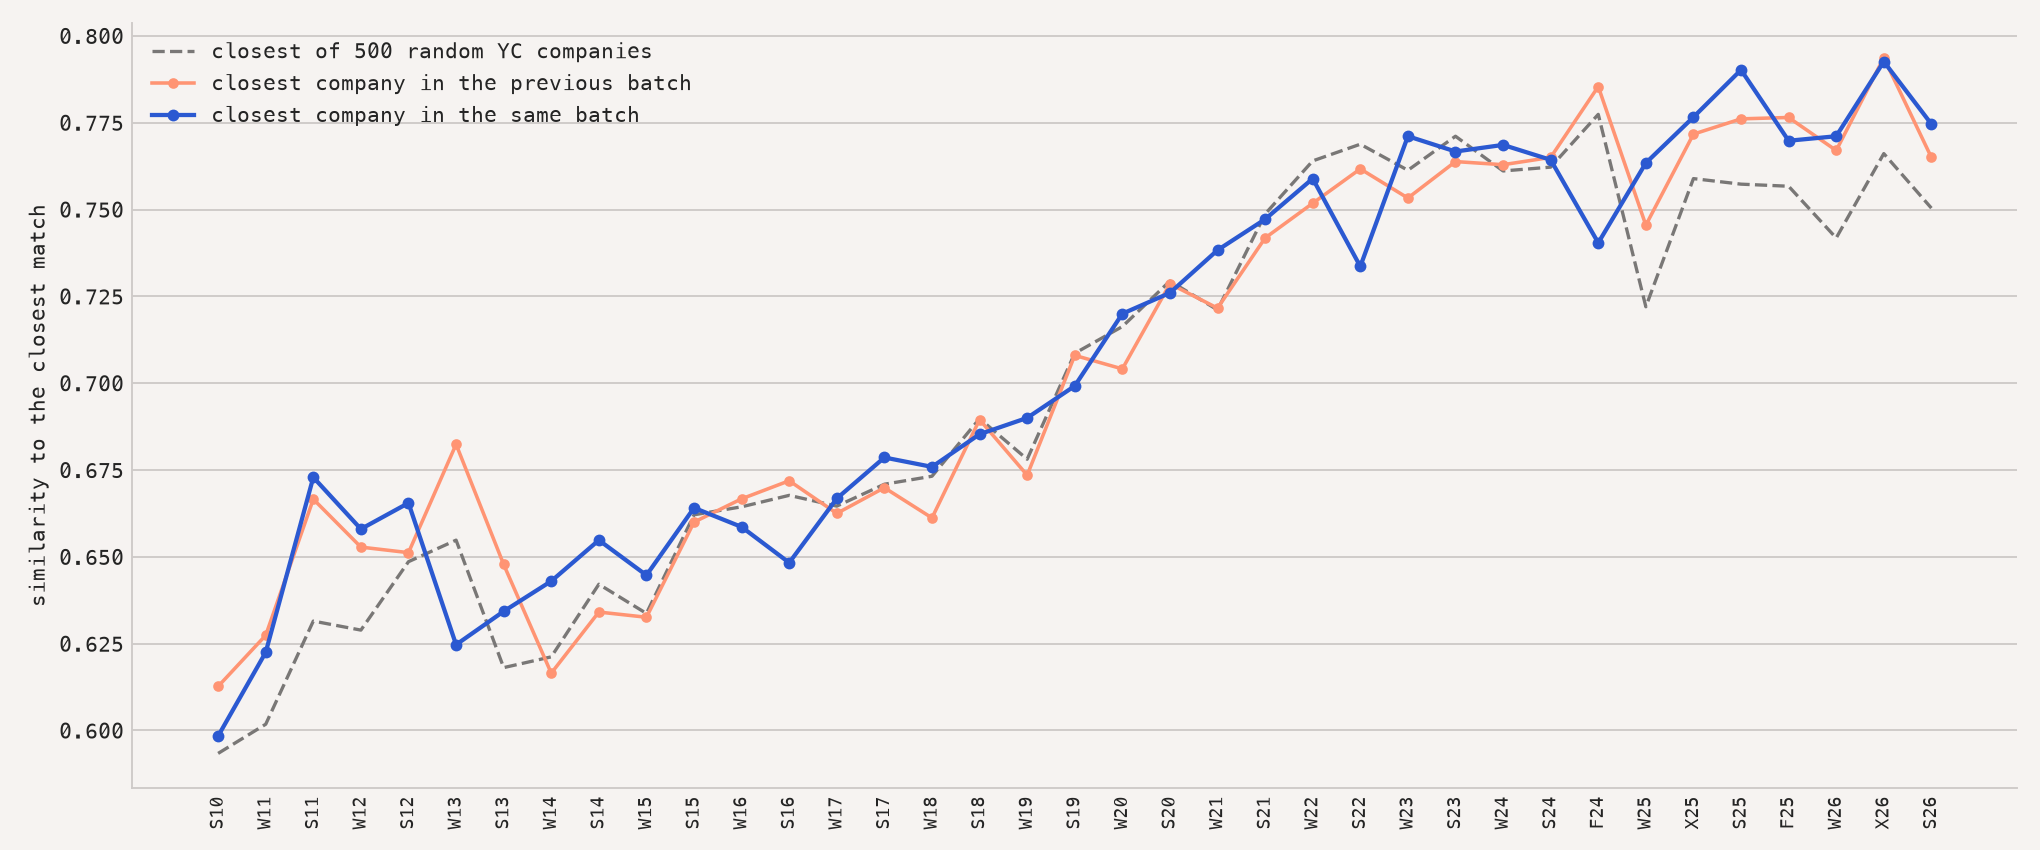
Average similarity to a company's closest match, measured within its own batch, within the batch immediately before it, and within 500 randomly drawn YC companies.
From Winter 2014 to Summer 2024, twenty-two batches in a row, the closest match in the previous batch and the closest match in a random 500 never differ by more than 0.013, and average 0.005 apart.
That changes at the end. The seven batches from Winter 2025 to Summer 2026 sit 0.020 above their control on average, with Spring 2026 the highest at 0.028. That is a small gap over seven batches, and it is the first stretch where the sign is consistent.
Run backwards, the 2013 to 2019 batches give 18.8% instead of 18.3%
If the rise were about time, old batches should look unlike the future and new batches should look like the past. We checked, and they do not.
For the 2013 to 2019 batches, the share with a 0.80 match among 500 random earlier companies is 18.3%. Among 500 random later companies it is 18.8%. Among 500 companies drawn from any other batch, past or future, it is 18.6%. A 2015 company is about as likely to have a twin in 2024 as in 2011. What changed is that recent batches are dense against any 500 companies you draw, which is a count of how many companies now describe themselves the same way.
Seven cross-batch pairs above 0.93 are the same product in different years
These are high-scoring pairs between two different batches where both companies still describe the same product today. Ranked by name.
| Company | Batch | Company | Batch | Similarity |
|---|---|---|---|---|
| Browser Use | W25 | Notte | S25 | 0.940 |
| Contrario | W25 | Perfectly | W26 | 0.954 |
| GovDash | W22 | GovEagle | W23 | 0.939 |
| Greptile | W24 | cubic | X25 | 0.943 |
| Hammr | W23 | Trayd | S23 | 0.952 |
| Kimono Labs | W14 | Dashblock | S19 | 0.943 |
| Meticulous | S21 | Canary | W26 | 0.944 |
Kimono Labs (Winter 2014, "create APIs where they don't exist") and Dashblock (Summer 2019, "turn any website into an API") are five years and one wording apart. Greptile (Winter 2024, AI code review with full context of your codebase) and cubic (Spring 2025, AI-powered code review) are two batches apart. GovDash (Winter 2022) and GovEagle (Winter 2023) both sell software for winning government contracts.
The highest raw scores in the file are not these. The top cross-batch pair is Foreword (Summer 2020, listed by YC as a marketplace for live online workshops) against Patchwork (Winter 2024, an AI communication tool for teams) at 0.956, and seventh is Bumpline (Summer 2017, listed as "Captain Tailor is the Uber for tailoring") against Booth AI (Winter 2023, generative AI product photography) at 0.951. Neither of those domains still runs the business YC funded, and the embedding read whatever is on the page now. We left pairs like that out of the table.
Six within-batch pairs above 0.91 are competitors funded in the same batch
| Company | Company | Batch | Similarity |
|---|---|---|---|
| Avoca | Sameday | W23 | 0.936 |
| Crew | Stardex | S21 | 0.946 |
| Hexa | Korso | X26 | 0.917 |
| MindFort | Casco | X25 | 0.929 |
| Playgent | Halluminate | S25 | 0.921 |
| Sendbird | Netomi | W16 | 0.932 |
Crew ("next gen ATS/CRM for modern recruitment agencies") and Stardex ("AI native ATS + CRM for executive search firms") were funded in the same batch. So were Avoca ("AI-powered sales agent for service-based industries") and Sameday ("the leading AI workforce for the trades").
The most isolated company, Glio in Summer 2013, tops out at 0.351
The lowest best-in-batch match in any batch of 30 or more belongs to Glio (Summer 2013) at 0.351, then Make School (Winter 2012) at 0.394. In the recent batches the most isolated company is Apollo Atomics in Spring 2026, at 0.527, which builds compact nuclear reactors. So the most isolated company in a 2026 batch, at 0.527, still scores above the average pair in a 2015 batch, which was 0.417 to 0.432.
One apparent outlier is a data error. Lakonia in Fall 2025 scores 0.409 because
its listed domain is lakonia.us.com, and our domain cleaner reduced that to
us.com. We excluded it.
Data funnel
| Step | Rows |
|---|---|
| YC companies listed with a domain field | 6,146 |
| Unique domains after normalisation | 6,143 |
| Domains with a vector | 6,143 |
| 1 row listed under a future batch (Winter 2027), dropped | 1 |
| Companies in the published file | 6,142 |
| Batches represented | 48 |
| Batches with 10 or more companies, used for within-batch stats | 46 |
| Batches with 30 or more companies, used for the cohort charts | 37 |
| Companies in those 37 batches | 5,956 |
Three rows were dropped as duplicate domains. Two of the three come from
companies whose listed website is an app store link: apps.apple.com and
itunes.apple.com both normalise to apple.com. Twenty-one rows had a
subdomain removed by normalisation, most of them harmless
(business.stayflexi.com to stayflexi.com) and a few not
(play.google.com to google.com, lakonia.us.com to us.com).
Eleven batches hold fewer than 30 companies with vectors, 186 companies in total, and are left out of the cohort charts. They are the ten batches from Summer 2005 to Winter 2010, and Fall 2026 with 19 companies.
Method
Every company on ycombinator.com/companies with a domain was embedded once with OpenAI's text-embedding-3-large at 1024 dimensions. The text embedded is a standardised five-sentence description written by gpt-5-mini from two inputs: a ScrapingBee render of the company's current homepage, and search snippets for the domain from Serper. The prompt asks for the same five things about every company, in the same order, in neutral wording: what it sells, who buys it, how it is delivered, what market it sits in, and what it charges for. Standardising the description is what stops the measure from picking up website copywriting style instead of what the company does. Where the homepage returned nothing usable, 206 companies or 3.4% of the file, the description falls back to YC's own one-liner and long description. Those fallbacks are concentrated in older batches, which works against the rise reported here rather than for it.
The vectors describe each company as it is today. This is the largest limitation in the work, and it can push the numbers either way. A 2017 company that has since pivoted into AI will match 2025 companies for reasons that have nothing to do with what YC funded in 2017. A 2016 pair like Sendbird and Netomi scores 0.932 because both sell AI customer support in 2026, not because they were alike in 2016. We have no snapshot of these homepages at batch time, so we cannot separate "YC funded two similar companies" from "two companies grew similar". The controlled twin share is less exposed to this than the raw one, because pivoting toward a common destination inflates matches in every direction, and the backwards test above shows old-to-new and new-to-old give the same number.
Similarity is cosine between unit-normalised vectors. Three thresholds appear in this report. 0.75 is roughly "same broad market": two B2B SaaS tools for different jobs land here. 0.80 is "same product category", the level that pairs GovDash and GovEagle, both selling government-contracting software. 0.85 is "a reader would call these competitors", where Hammr and Trayd, both construction payroll platforms, sit at 0.952.
Two controls run against every batch. The within-batch control draws a random sample of YC companies of the same size as the batch, from all years, and takes the average pairwise cosine inside that draw. The prior control draws a fixed 500 companies from batches earlier than the one being measured and takes each company's best match into that 500. Both average ten draws. All draws use numpy default_rng with seed 17.
The fixed 500 is the part of the design that matters most. Without it, a batch's measured similarity to "everything before" rises purely because there is more of everything before. Batches earlier than Summer 2013 have fewer than 500 prior companies to draw from, so they get no controlled number and do not appear in the twin-share chart or table.
Connected components at 0.80 are built by linking every pair at or above the threshold and taking the components of the resulting graph. They are transitive by construction.
Data
Everything in this report is in the files below, under CC BY 4.0.
- companies.csv, one row per company: domain, name, batch, and the best match with its score within the batch, in earlier batches, and in any other batch
- batch_stats.csv, within-batch similarity and the random control, per batch
- prev_batch_stats.csv, each batch against the batch before it and against all prior batches
- prior_twin_share_controlled.csv, the fixed-500 twin shares against earlier, later and any other batches
- pairs_top.csv, the 200 closest within-batch pairs with one-liners
- cross_batch_pairs.csv, the 1,000 closest pairs between different batches
- README.md and METHOD.md
No vectors are published.