Startup funding: US vs Europe vs China
Updated 23 Oct 2026
US startups closed 8,496 of 20,088 funding rounds from October 2025 to September 2026 (42.3%). European startups closed 3,351 (16.7%) and Chinese startups 3,260 (16.2%). Source: FundingWatcher, October 2026.
- Value
- 8,496
- Unit
- startup funding rounds in the United States, October 2025 to September 2026
- Data as of
- 23 October 2026
- Source
- FundingWatcher, October 2026
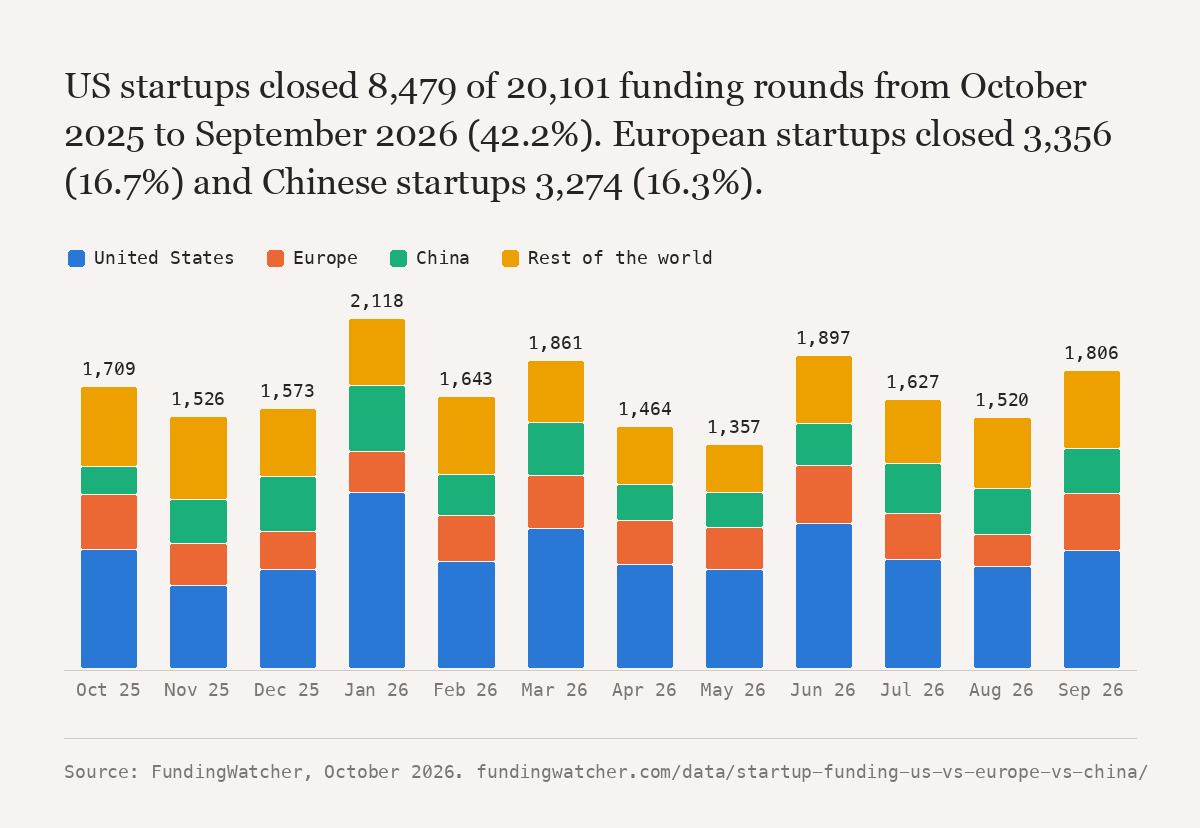
Region
| Region | Rounds | Share of all rounds | Raised | Median seed | Median Series A | AI share of rounds |
|---|---|---|---|---|---|---|
| United States | 8,496 | 42.3% | $179.2B | $2.4M | $18.7M | 47.0% |
| Europe | 3,351 | 16.7% | $48.7B | $2.6M | $14.6M | 33.9% |
| China | 3,260 | 16.2% | $49.9B | $2.8M | $14.4M | 16.3% |
| Rest of the world | 4,981 | 24.8% | $35.6B | $1.5M | $7.2M | 25.4% |
Table 1. Startup funding: US vs Europe vs China, by region. Source: FundingWatcher. Data as of 23 October 2026. Base: 20,088.
Previous values
| Month | Data as of | Value |
|---|---|---|
| October 2026 | 19 October 2026 | 8,479 |
| September 2026 | 28 September 2026 | 8,322 |
Table 2. Startup funding: US vs Europe vs China, value at each monthly update. Source: FundingWatcher. Data as of 23 October 2026.
Method: Rounds dated October 2025 to September 2026, counted from the startup file of 23 October 2026. The file keeps each company's most recent pre-seed, seed, angel or Series A to J round only, so a company that raised twice in the window counts once. Europe is the EU 27, the United Kingdom, Switzerland, Norway, Iceland and Liechtenstein. Full method.
Cite or embed
https://fundingwatcher.com/data/startup-funding-us-vs-europe-vs-china/
<a href="https://fundingwatcher.com/data/startup-funding-us-vs-europe-vs-china/"><img src="https://fundingwatcher.com/static/figures/startup-funding-us-vs-europe-vs-china.png" alt="US startups closed 8,496 of 20,088 funding rounds from October 2025 to September 2026 (42.3%). European startups closed 3,351 (16.7%) and Chinese startups 3,260 (16.2%)." width="1200" style="max-width:100%;height:auto"></a>
<p>Source: <a href="https://fundingwatcher.com/data/startup-funding-us-vs-europe-vs-china/">FundingWatcher</a>, October 2026</p>